AI Investor Barometer
What is AI Investor Barometer?
AI Investor Barometer is an experimental comparison tool that uses five different AI models to generate valuation assumptions for listed stocks daily. Each model — GPT, Claude, Gemini, DeepSeek and Grok — independently produces its own estimate from the same company's public data. Results are presented side by side.
Currently tracking 12 Finnish Nasdaq Helsinki stocks and 12 US large-cap companies. The pipeline runs automatically on business days.
The project does not provide investment recommendations or advice. It is an experimental research tool: what do different AI models estimate about the same stocks, and do they differ from each other?
Explore the data
Platform in Numbers
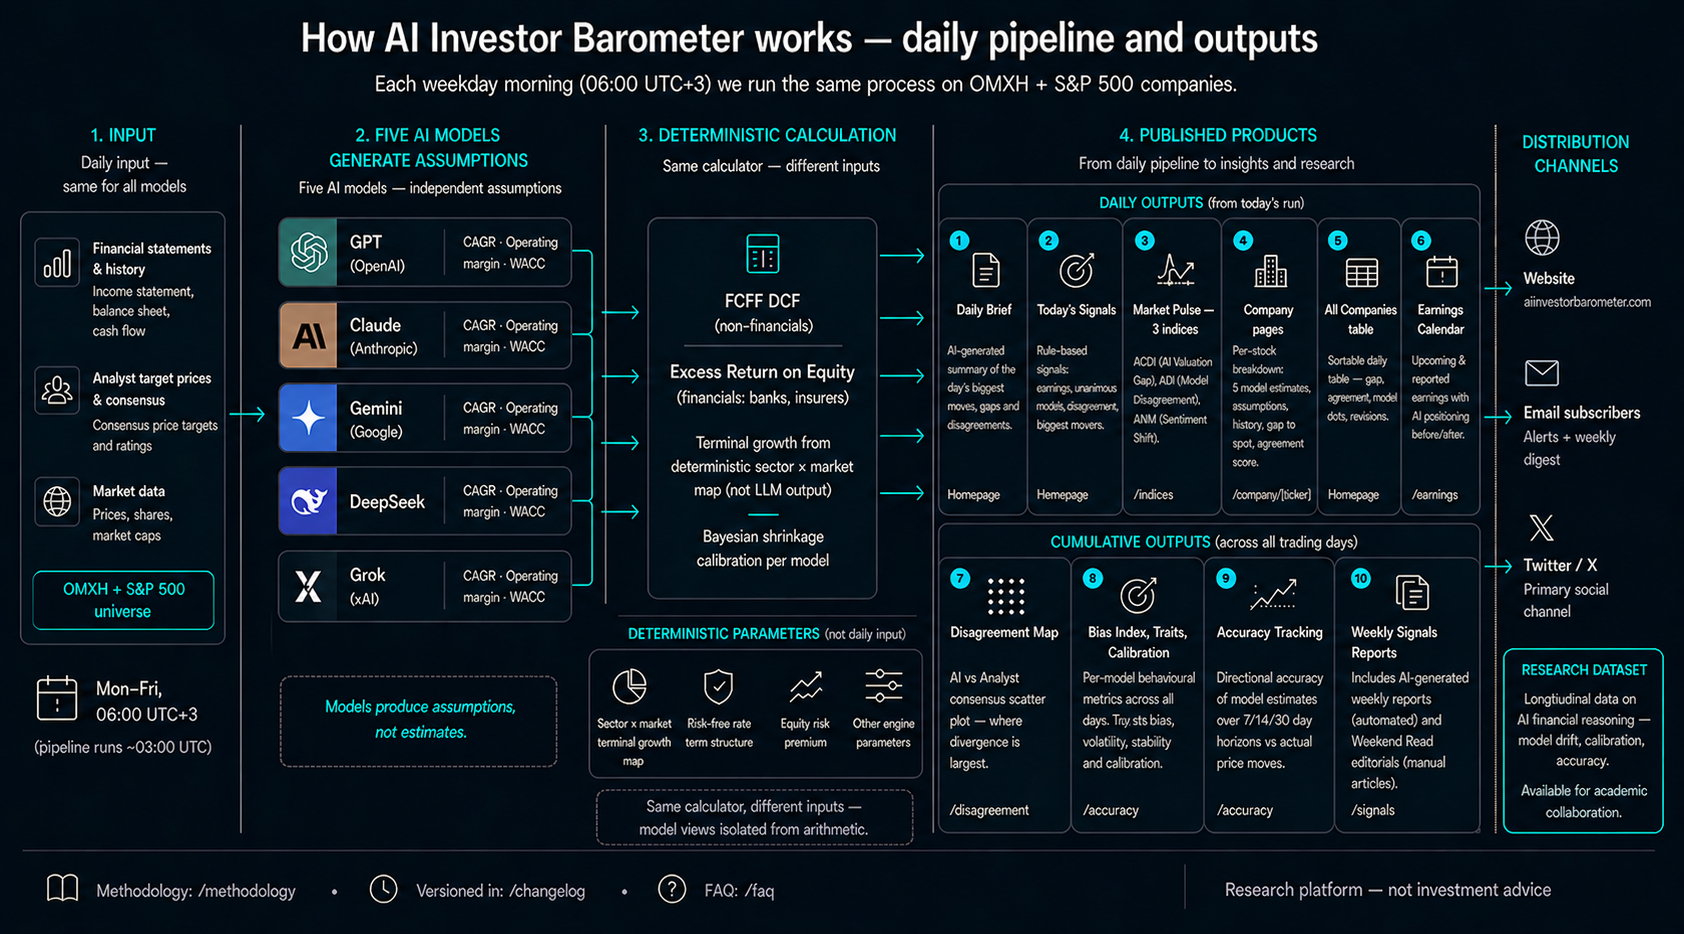
Daily pipeline and outputs
Why Compare AI Models?
AI is increasingly involved in investment decisions — either directly or indirectly through analysis tools, news aggregations and chatbots. The problem is that a single model appears reliable even when it is systematically over- or under-estimating certain stocks.
When five different models estimate the same company on the same day, you immediately see:
- Do the models agree — or do estimates diverge dramatically?
- Is any model consistently higher or lower than others?
- Does any model change its estimates daily, while another remains stable?
- Does any model stay closer to analyst consensus than another?
These questions are essential if you want to understand how different AI models differ. This tool makes model-specific comparison visible.
How AI Models Generate Estimates
Most AI outputs are black boxes: the model gives a number directly without you knowing how it arrived at it. In this project, the approach is different.
This approach makes model-specific differences transparent: if GPT and Claude arrive at different estimates, it's due to different growth assumptions — not because one "calculated incorrectly".
AI Model Comparison Metrics
Limitations and disclaimer
- Not investment advice. All content consists of AI models' computational estimates, not investment advice. Draw your own conclusions.
- AI models can be systematically wrong. Models learn from historical data that may be biased or incomplete. A high confidence score does not mean being correct.
- Public data only. Models use only publicly available financial data and market information.
- Experimental tool. This is an experimental AI comparison and measurement tool. Data may be incomplete, the scheduler may fail, results may be incorrect.
Research Background
A growing body of academic research examines whether large language models can reason about financial data. Most studies test a single model on a single task — sentiment classification, earnings prediction, or stock price forecasting. This project takes a different approach: five LLMs run the same valuation task daily, over months, producing a behavioural dataset that captures how model opinions form, drift, and diverge.
The platform generates three types of empirical data that are difficult to obtain elsewhere: temporal consistency (how much a model changes its estimate for the same stock day to day), cross-model disagreement (where models converge and where they don't), and assumption-level transparency (the exact CAGR, margin, and WACC inputs each model produces, not just the final number).
Selected references from the emerging LLM-finance literature:
- Kim, A., Muhn, M. & Nikolaev, V. (2024). Financial Statement Analysis with Large Language Models. University of Chicago Booth.
- Lopez-Lira, A. & Tang, Y. (2023). Can ChatGPT Forecast Stock Price Movements? SSRN.
- Xie, Q. et al. (2024). FinBen: A Holistic Financial Benchmark for Large Language Models. arXiv.
Pipeline Diagnostics
| Model | Avg Latency | Tokens (in / out) | Cost / Run | Valid % |
|---|---|---|---|---|
| Claudeclaude-sonnet-4-6 | 30.3s | 174.9k / 33.0k | $1.020 | 100% |
| Deepseekdeepseek-v4-flash | 17.1s | 143.3k / 41.0k | $0.084 | 100% |
| Geminigemini-2.5-flash | 19.4s | 158.5k / 16.6k | $0.281 | 100% |
| Gptgpt-4o-mini | 10.8s | 134.5k / 9.5k | $0.431 | 92% |
| Grokgrok-4.3 | 6.9s | 137.6k / 9.8k | $0.373 | 100% |
Contact & Feedback
Have feedback, a collaboration idea, or a question? We'd love to hear from you.